
How to group time management?
Clustering time management conducted on a sample of playersBefore reading this post
The games in this analysis were lichess-annotated 10+0 rapid games from July 2023. More about the data can be found at the lichess open database. The ?? players with the most games were chosen for this study. I decided to look at five players and if there was a trend in their time management. I am also sharing some data and code at the end. This study was not conducted on all players. This post will most likely be followed by part 2 where I dive deeper into all the players' gameplays.
Motivation and Introduction
This study emerged as part of my journey of grouping lichess players' gameplay patterns. It has been long time since my last blog post update. Most of it is related to generating my new July lichess database and working on this project. I was primarily looking at Time and Time spent and the relationship between them. This post will not give you a full analysis conducted on the full sample of players. However, I managed to make shareable data where you can follow along.
Process
The process can be followed in the GitHub link. I have attached the data you can start with and the data I will be using in this specific post.
The idea behind this process was to view Time right after the move and Time Spent during the move as some form of time series. There are pre-existing tools that allow us to cluster time series based on distance. The most obvious distance would be to normalize and calculate Euclidean distance (this is the distance we all know). However, there is another tool called Dynamic Time Warping (DTW). Basically, it allows you to compare time series based on how it is shaped.
There are some obvious limitations of the project. I used some arbitrary numbers for the analysis. It was sampled on 5 of the 20 players with the most 10 + 0 rapid games and randomly sampled another 100 of their games. I also chose 5 clusters for the KMeans cluster. These arbitrary choices do impact the analysis but it lets us start simple. The more generalized trend will be covered later.
Analysis and Result
The exact dataset used to visualize is included in the link. We have 5 groups of time management from 5 players from 1000 games. Each category had at least 150 games. The categories were balanced.
| Category | 0 | 1 | 2 | 3 | 4 |
|---|---|---|---|---|---|
| count | 203 | 214 | 198 | 155 | 230 |
If we graph Time - TimeSpent on each category it looks as follows. (You can click both images to view them better).
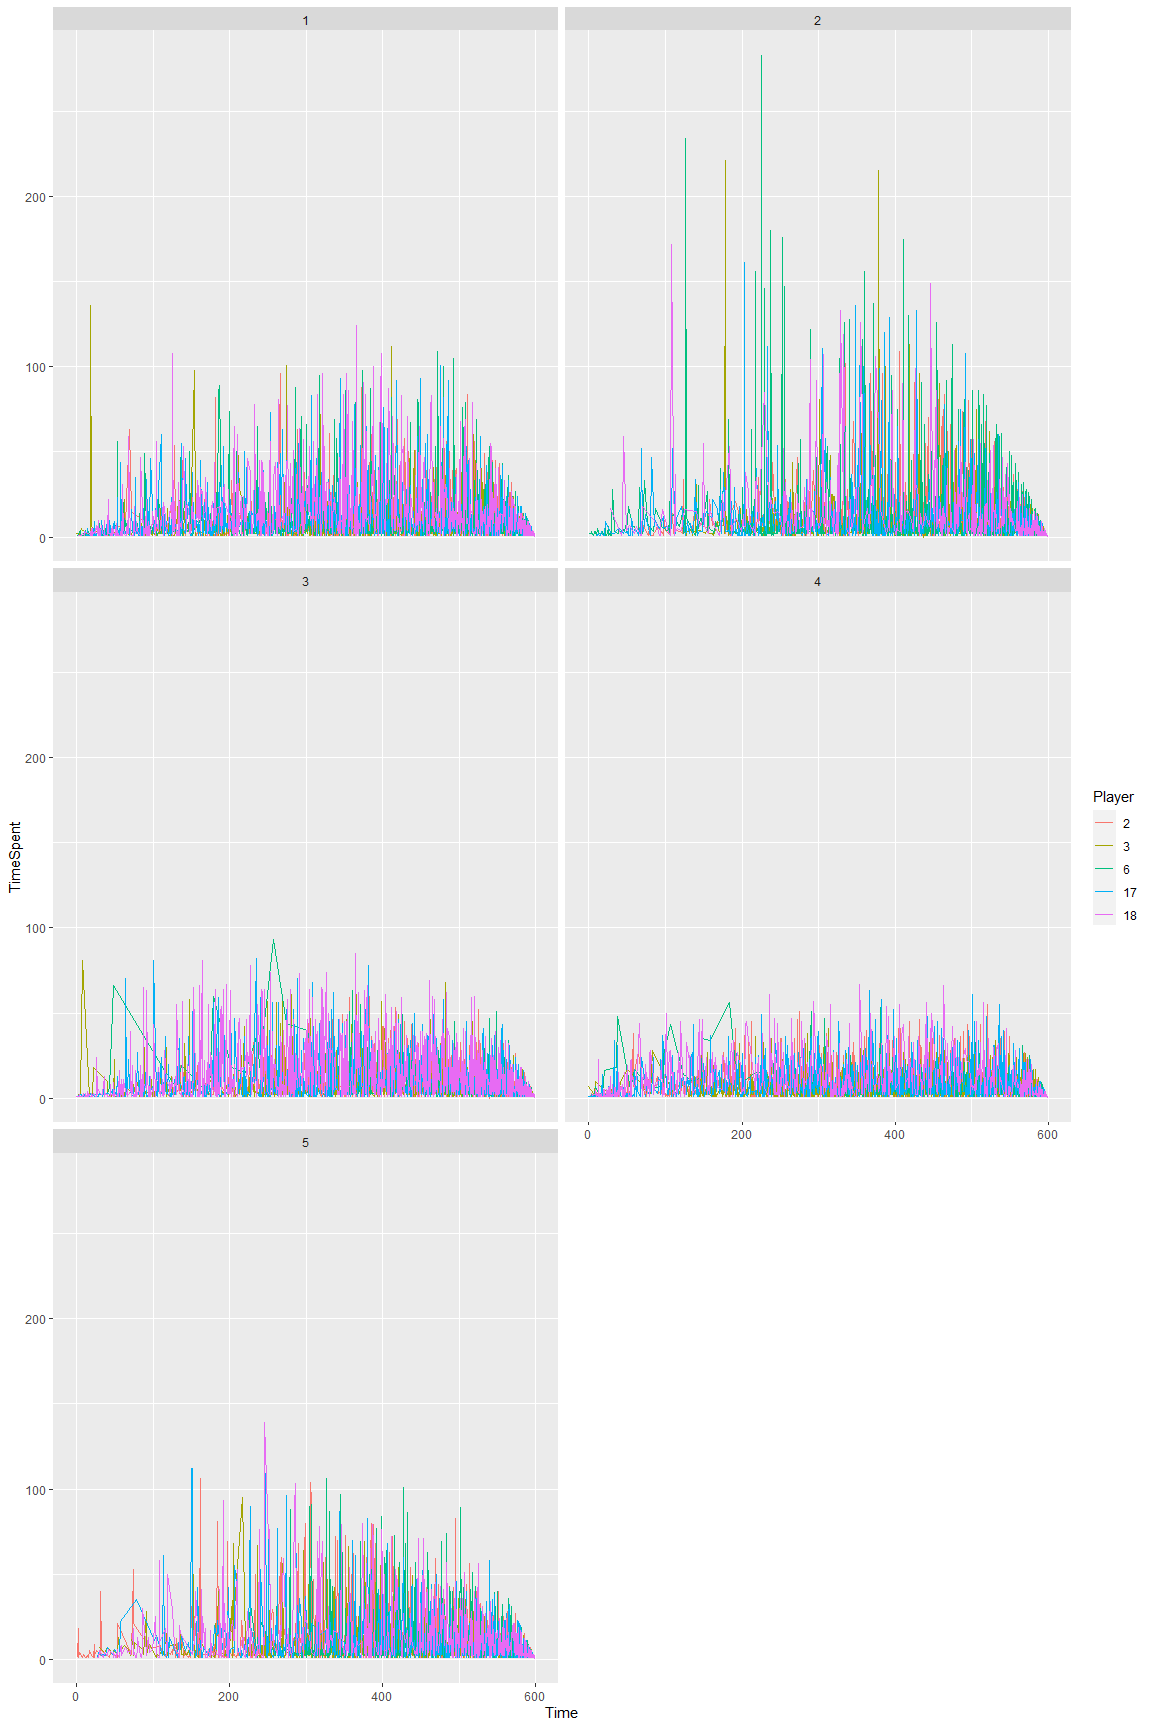
For clarification, I chose 5 random games from each category and visualized them.
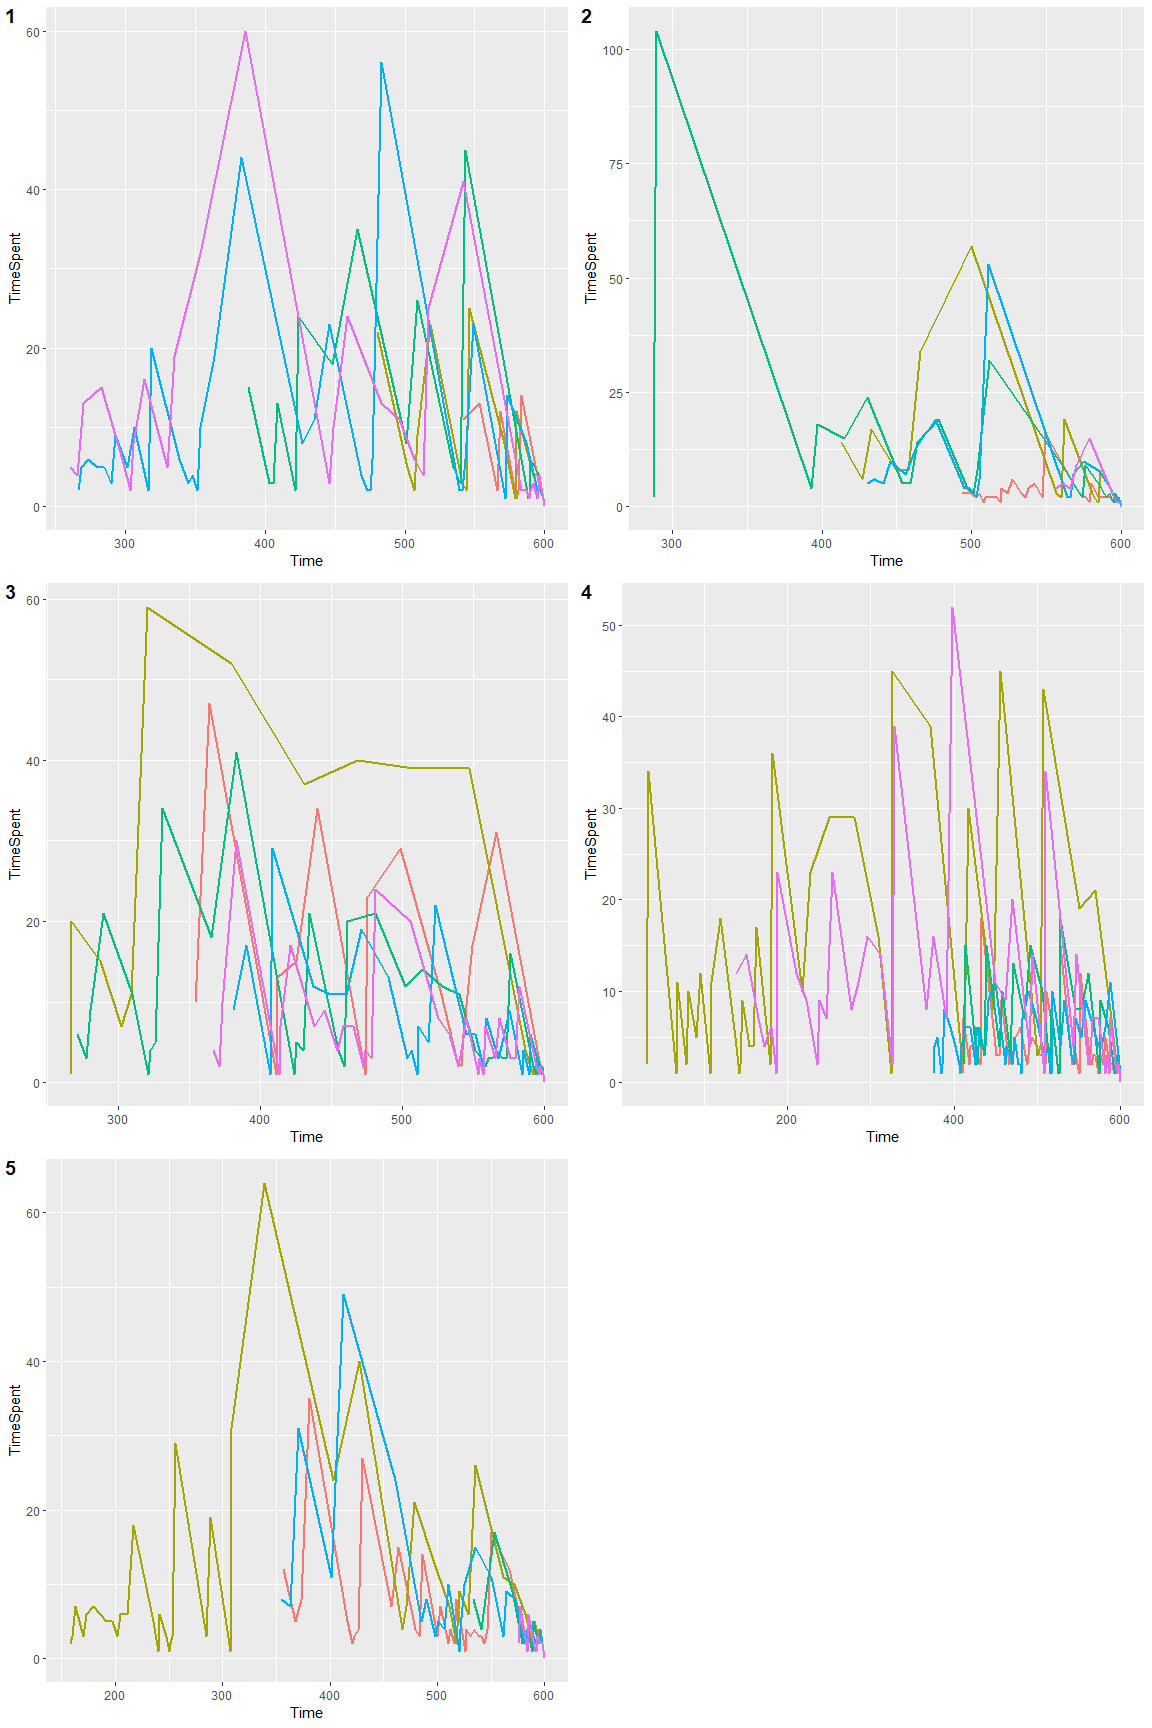
The average and standard deviation of Time Spent by groups were as follows.
| Time Spent | 1 | 2 | 3 | 4 | 5 |
|---|---|---|---|---|---|
| average | 8.72 | 8.75 | 8.67 | 6.66 | 8.27 |
| SD | 13.06 | 17.33 | 11.23 | 7.76 | 12.33 |
There are some very obvious differences in some groups.
- Group 2 can be described as "1 Long think". Group 2 has a very high max value (some going over 100 seconds per move). Out of the top 20 moves with the most time used, 15 of them belonged to Group 2. Group 2 also has the highest standard deviation.
- Group 4 can be described as "Quick moves". Group 4 has the lowest average and standard deviation. Players with this style were playing fast moves and thought for brief moments throughout the entire game.
- The other groups (1, 3, 5) are harder to distinguish just from this graph.
- Group 1 can be described as a "Slow Opening". Group 1 has the highest average time in the first 3 minutes.
- Group 3 can be described as "Considerate". They are very similar to Group 5. None of Group 3 spent over 100 seconds on a move.
- Group 5 can be described as the "Average". The average and standard value is almost equal to the general dataset.
| First 3 minutes | 1 | 2 | 3 | 4 | 5 |
|---|---|---|---|---|---|
| average | 7.75 | 7.31 | 7.17 | 6.00 | 6.99 |
| SD | 11.45 | 12.54 | 8.52 | 6.73 | 9.19 |
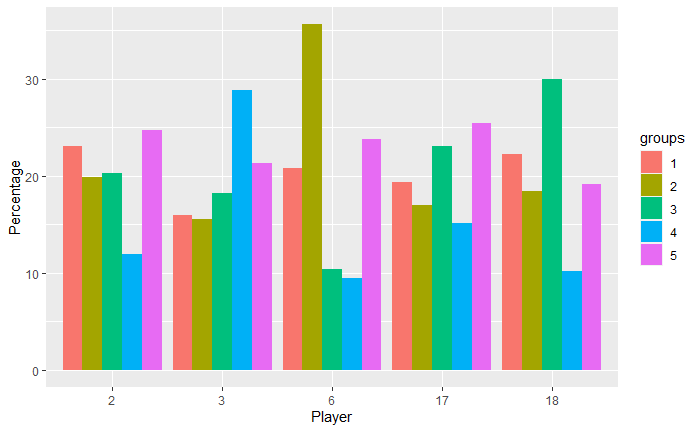
We are also curious if the 5 players each have a play style. It turns out to be true.
- Player 6 has a high percentage of group 2 taking 1 long thinking time during the game.
- Player 3 has a high percentage of group 4 making fast moves and short thinking time.
- Players 17 and 18 have a very similar group distribution.
Conclusions and Limitations
From the analysis we did, we gave explanations for the 5 clusters. We gave them some descriptions such as "Quick move", "1 long think", and such. I have conducted some hyperparameter tuning but having too many clusters will lower the explainability and intuitiveness of the analysis. However, there might be a better choice of the number of clusters and also the number of games to be analyzed. This is very much influenced by computational capabilities. My computer crashed a few times trying to go for a large number of games. I will come back with some other analysis. Thank you for reading!
You may also like
 oortcloud_o
Equal material but is it equal?
analyzing equal material positions in 3+0 games oortcloud_o
Linking top players based on openings
Using relatedness network on opening choices of top grandmasters GM NoelStuder
Why Losing At Chess Hurts So Much (And The Antidote)
Losing a chess game hurts. It certainly hurt me a lot in my professional days. Sometimes I needed da… oortcloud_o
Which openings are related?
simulating opening connectivity graphs with known techniques oortcloud_o
3+0 vs 3+2 the difference?
a brief time analysis oortcloud_o